Effective protection of the points of attack
So how do you protect yourself against attacks and the possible consequences? The responsibility here lies not only with the manufacturers but also with the operators. They must implement the manufacturer's measures and constantly keep an eye on whether the systems are up to date.
- Network segmentation PV components should be strictly separated from the home or company LAN and ideally only accessible via dedicated VPN channels. Remote access to monitors etc. must never be unencrypted or public.
- Strong authentication Standard passwords must be changed immediately. All applications should use multi-factor authentication (MFA) to prevent identity theft.
- Regular updates & patches Firmware and software updates are mandatory. Manufacturers are continuously working on so-called manufacturer patches, i.e. updates for software that address security vulnerabilities. The patches are included in the firmware updates and must be installed by the operators.
- Monitoring & logging All access and configuration changes must be auditable. Special monitoring tools help here by detecting anomalies and unauthorized access at an early stage.
- Backup & incident response An emergency plan for data leaks or system failures is essential. Data must be backed up and those responsible must know how to react correctly to incidents.
- Employee training It is important that technical employees and operators are regularly trained in cyber security and sensitized accordingly - for example, about phishing attacks, social engineering or social media risks.
- Data protection & GDPR Always make sure that manufacturers have a corresponding data protection regulation. Live electricity data contains personal information and therefore requires special protection. It may only be passed on on a contractual and legal basis, in accordance with GDPR regulations.
Security measures in PV monitoring
In principle, the points listed above apply to all PV system systems that allow attackers to access the system. In addition to inverters and gateways, this also includes PV monitoring and PV management systems. The so-called "energy managers" in particular, such as those from Solar-Log™, form the interface between the PV system and the energy suppliers and must be protected accordingly.
The example of Solar-Log™ shows how such systems are protected - both by the manufacturer and by the operators.
A key issue in protecting the PV system is securing data transmission. Solar-Log™ relies on modern encryption standards such as TLS (Transport Layer Security) to ensure secure communication between devices, portals and mobile applications. In addition, data in the cloud is also protected by encryption. The cloud service providers used are certified in accordance with ISO 27001, which guarantees high standards of security and availability.
Another focus is on user and access management. Solar-Log™ uses the principle of least privilege and introduces role-based access control. Users must use strong passwords and two-factor authentication (2FA) is offered on request. Access processes are fully logged and can be analyzed if required.
Strict security principles are also followed in software development. The source code is checked internally, regularly scanned for vulnerabilities and checked by external penetration tests. This is to ensure that vulnerabilities are discovered and eliminated at an early stage. Customers are informed about security-relevant updates and receive clear instructions on how to install new firmware.
In the event of a security incident, Solar-Log™ has its own incident response team. This team analyzes and evaluates detected security problems, coordinates countermeasures and informs affected users as quickly as possible. The response processes are documented and regularly tested. Particularly noteworthy is the response to known vulnerabilities such as CVE202247767 (backdoor in older firmware versions), which have been rectified by corresponding updates.
In addition, Solar-Log™ already pays attention to security aspects during product development ("Security by Design"). This includes, for example, the use of PKCE (Proof Key for Code Exchange) for web authentication. The integration of secure technologies and the protection of local device interfaces against unauthorized access are also standard.
In summary, it can be seen that a holistic approach to cyber security is being pursued. This combines technical measures with organizational processes and focuses on transparency and continuous improvement.
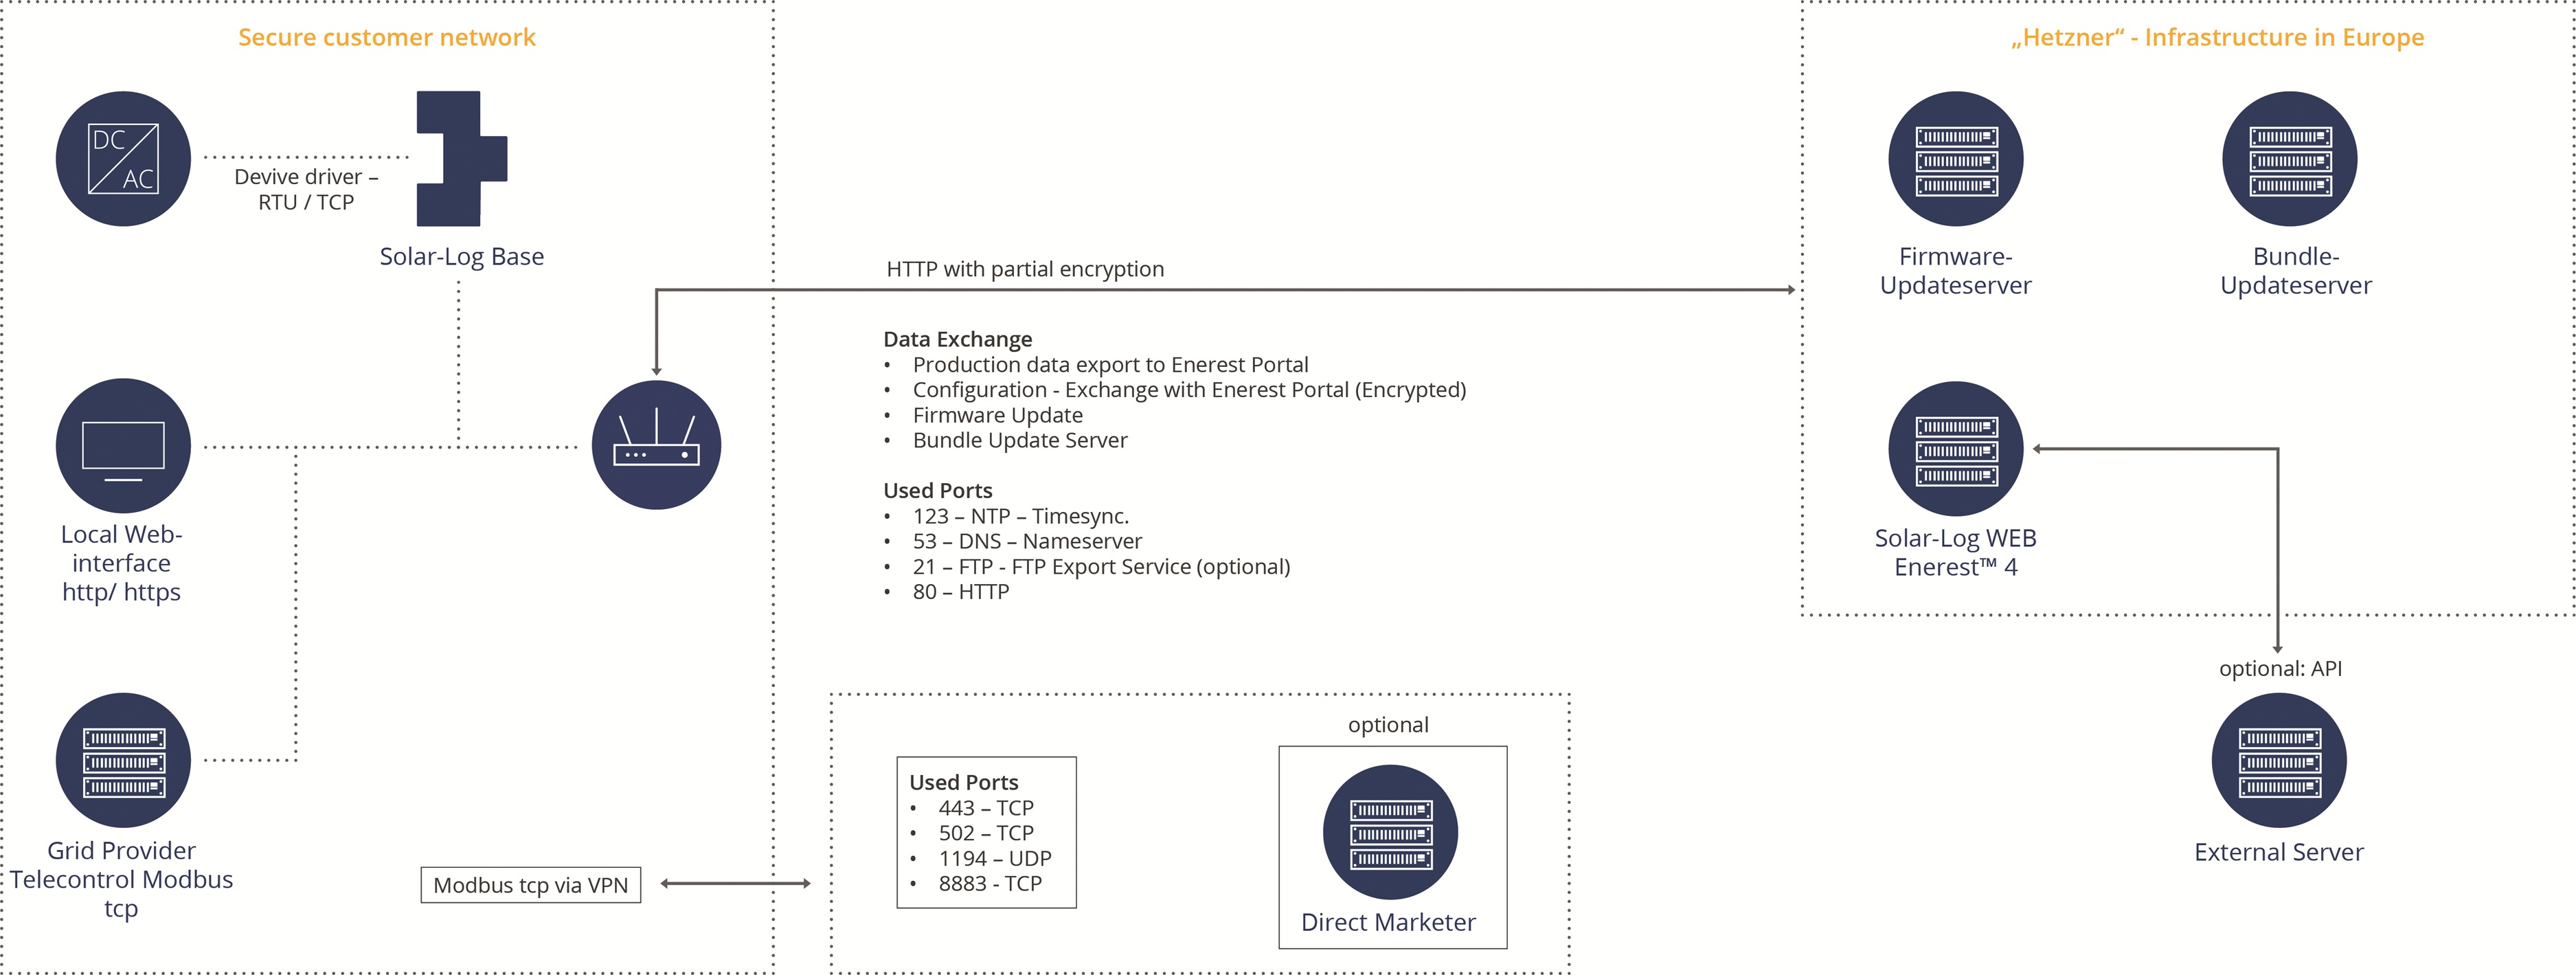
The image shows the network communication of the Solar-Log™ Base PV energy management system in a secure customer network. Here, data is transferred to the Solar-Log WEB Enerest™ online portal and firmware and bundle updates are carried out. This architecture ensures secure, structured communication between local devices, cloud services and optional partners such as direct marketers or external servers.